
We monitor and continuously optimize your site’s performance.
The Principal WP Optimizer was built and trained by two engineers who’ve run some of the largest sites WordPress hosts, and it makes the fixes they’d make themselves.
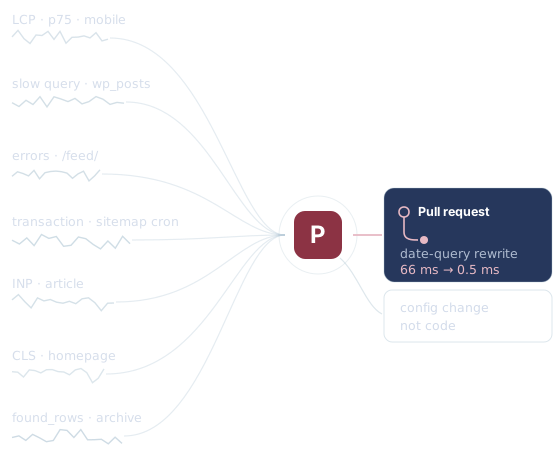
Every fix follows the same four steps.
It runs from the monitoring you already have in New Relic to a pull request your team merges.
1
It starts with what your site already tracks
The Optimizer reads the monitoring you already run in New Relic and finds what’s slowing the site.
2
It finds the root cause in your codebase
It reads your actual code to find the root cause behind the alert. Sometimes the fix isn’t code at all: a config change, or an index your host can add. When that’s the answer, it tells you.
3
Every fix is proven before anyone sees it
The fix is applied to your staging site and measured before and after.
4
The fix arrives as a pull request
One of the founders reviews every fix before it reaches you, and your team merges it. After the deploy, the same monitoring that surfaced the problem confirms the fix in production.
Can’t I just ask Claude to do this for me?
The Optimizer doesn’t rely on Claude, Codex, or Gemini knowing what to find or how to fix it.
We built its playbooks from our years running some of the largest sites WordPress hosts. Off-the-shelf models know the surface-level WordPress optimizations, but not how to rewrite a component for performance.
While we also handle surface level performance improvements, our playbooks create migration scripts to restructure your data and change your code so that the structure underneath your site is set up for performance. All without any downtime or any data loss. Over several days and several commits the data is transformed to fix the root causes of performance bottlenecks.
Similarly for front end optimizations our playbooks help us restructure the Critical Rendering Path to ensure the best possible Core Web Vitals scores without sacrificing ad viewability or revenue.
What a fix looks like when it arrives.
Five parts of one real pull request the Optimizer opened this month:
What this does for your site: Article pages with shoppable product cards stop and wait for a live Amazon lookup whenever a card’s cache has expired. After this change, no reader ever waits on Amazon again.
Plain English before any code
After you merge: external calls to Amazon (~7,500 a day today) should drop to near zero within a day. Watch the per-host metric.
Names the exact metric that must move
Risk: revert is a complete rollback, except cache entries that expire on their own within 24 hours and one inert scheduled-job row.
What a revert leaves behind, exactly
Needs a human decision: how fast the background refresher runs, given how many products the site has. Accept this pace, or raise it.
Left for you to decide
fixer-prediction: {"metric":"ext_share","baseline":0.4603,"expected":0.44,"check_after_days":7}
The prediction, written down before the merge
Examples from production sites
On a large scale production site, the Optimizer improved performance dramatically, both at the front end and the backend.
Lead photo: 9.4s to 5.5s
Seconds until the lead photo appears, lab median of 21 runs:
before
9.4s
after
5.5s
−42%
lab medians · on a site copy
A quarter of real visits to a section page waited nine seconds or more for the lead photo to load. The image’s source was hidden from the browser, so the download couldn’t start until a chain of scripts had run. The fix puts the source right in the HTML and made sure it loaded right away.
Month archive query: 66ms to 0.5ms
Time the database takes to answer the same question, per run:
before
66ms
after
0.5ms
×130
rows read: ~411,000 → ~1,100
The WordPress query running this archive was taking 66ms to find all stories for a given month. The Optimizer was able to inspect the query, rewrite it, verify the data was still the same, and update the code. Now the query takes only about half a millisecond, or 130 times faster.
The heaviest query: 2.7s to 1.1s
The site’s heaviest query, per run:
before
2.7s
measured
1.1s
−60%
This query, the one the archive pages wait on, costs about ten hours of database time a week. The fix skips wasted duplicate-checking; results identical row for row, measured on a production-scale staging copy. The same fix barely moved on a smaller test copy with an older database engine; the win needs production-scale data on the engine the site actually runs, which is why it was measured there.
Always on comes with a downtime guarantee.
On the Always on plan, you’re covered against performance-related downtime.
If we don’t catch a performance problem that goes on to cause downtime within the first six hours of that code being live, you get a full refund plus the next year of service free.
We work at three cadences.
All three land the same way: a pull request your team reviews and merges.
One time
$5,000 $1,000
WordCamp US Special
A single pass over the site: we find what’s slowing it down and open each fix as a pull request.
Once every quarter
$10,000 $2,500
per year
The same pass every quarter, clearing what piles up between releases.
Always on
$20,000 $10,000
per year
The Optimizer watches your monitoring continuously and opens a pull request for each fix it finds.
Every engagement starts with a conversation.
The conversation is with the founders who review every fix.
Tell us what your monitoring keeps surfacing, or tell us you’re not sure what it’s telling you.
No sales pitch. No proposal template.